


Back in January 2020, I wrote an article on making MBTiles for use in OpenCPN or other navigation programs. An MBTiles file is a tile-based geographic map; its format allows users to save detailed collections of geo-spatial information as a single map. MBTiles still seem to represent the best way to get satellite images into a GPS-aware chart program, and show any chart offset(s), additional features, and generally get more detail in poorly charted areas in the world. The advice here was written in October 2022, but of course the data sources may change at any time so your mileage may vary.
Since 2020, additional data sources have become available; OpenCPN has changed, and I have learned a bit more that cruisers may find helpful. Thus, I thought I would take a few minutes to share an update of what I’ve learned lately.
Data Sources: it’s who you know (about)
Back a few years, only Google and Bing offered accessible data to download to make MBTiles. Now there are a few more interesting new sources:
ArcGIS
ArcGIS is a family of client, server and online geographic information system (GIS) software and associated data sources developed and maintained by Esri (Environmental Systems Research Institute). Esri is an international supplier of GIS software, web GIS and geo-database management applications and associated data. The image sets available through this data set are less ‘massaged’ than either Bing or Google, and that can be a very good thing.
Bing and Google massage their images to make them pretty and often clip a lot of the image out, replacing actual satellite images of the foreshore and ocean with ersatz ocean views, which contain no real data or value for the navigator. The Esri/ArcGIS images seem to be ‘rawer’ and sometimes that’s a good thing.
Navionics and Navionics SonarChart™
Navionics and Navionics SonarChart™ charts are now available. Of course, you don’t get the data (user notes, light characteristics, etc.) that a real subscription gives you, but you can see what are, in effect, raster versions of their vector charts. Details seem to cap out at around zoom level 16.
C-Map
Various C-Map charts are available. As in Navionics above, it’s just a raster version of a vector chart. Details seem to cap out at about zoom level 16. To gain access, you need to unzip the C-Map_V2.zip file found here into the SASPlanet\Maps folder to add C-Map functionality.
Combining and Comparing Sources
When using cartography based sources to make MBTiles, switch off the ‘Layers-Google-Hybrid’ for making the MBTiles so you don’t get double labeling on geographic features like islands. While the labeling can be useful in satellite image MBTiles, it’s just irritating in most cartography-derived images.
These sources may (probably will) change their access over time, so you may need to update SASPlanet to maintain access. The owners of the data may cut off access, or restrict your ability to download huge amounts of images (throttling) at any time as well.
To see what you might get from these sources, let’s have a look at Pedro Bank (or Petro Bank) south of Jamaica at about 17°00N, 077°48W in the Caribbean. It has an area of a depth to 40 metres (130 feet) in a triangular shape, 70 kilometres (43 miles) long east-west, and 43 kilometres (27 miles) wide. Of that, 2,400 square kilometres (927 square miles) are less than 20 metres (66 feet) deep. It’s pretty big and has four permanent islands and a few more rocks that break the surface. Cruisers want to avoid it, yet know where the edges are. Knowing where it’s sand and where it’s rock would be very useful.
Here’s how a few of the data sources represent it.
Google Satellite shows nothing:
Bing satellite shows two of the four permanent islands (the little white dots on the right):
The ESRI ArcGIS imagery shows the bank, indicates depths visually, shows all islands and rocks, and is generally very useful. But these images are at zoom level 12, and disappear at higher zooms, so any images you captured for MBTiles would need to use these lower zoom levels: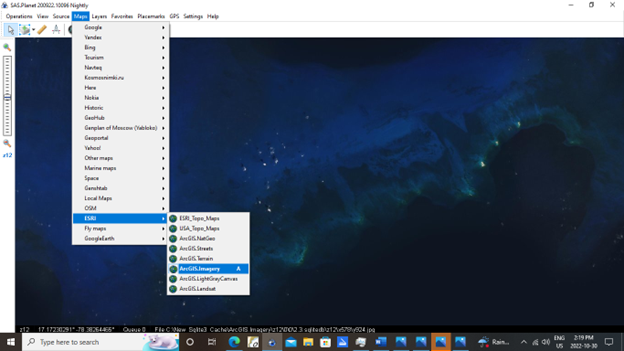
Navionics gives a useful overview, but would not help you find a patch of sand to anchor in:
C-Map offers a similar view to Navionics (not surprising considering they would be based on the same cartography provider):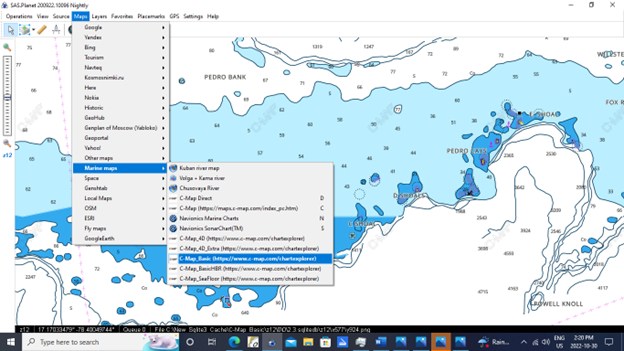
It’s always worth having a look at multiple sources. Some may not offer as a clear a view (or a view at all) of the ocean floor as others.
Time Marches On (but not at the same pace for all sources)
Some sources are newer than others. For example, they have extended the western breakwater in Ensenada, Mexico. But not every source seems to know this, as you can see below.
Google satellite shows the shorter old breakwater: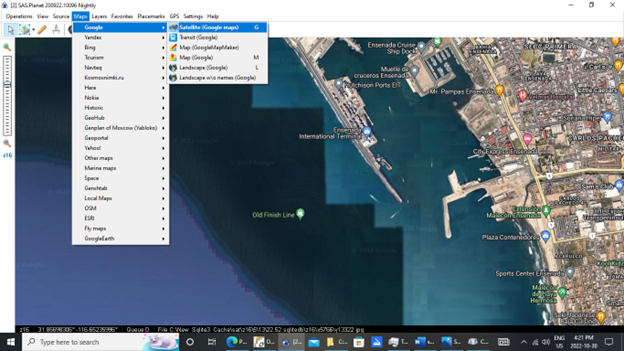
Bing shows the new extension:
C-Map doesn’t have the new construction:
Navionics does show it:
Frequency of updates matters! The schedule of updates differs for different providers, so check on who has what available.
Close Enough, But No Closer
Sometimes, image providers use images from different satellite passes for different zoom levels. Different passes may be made at different stages of the tide, with a different angle of the sun, or with clouds blocking the view. While I usually like zoom level 18 for detail, sometimes lower magnifications provide a better view or more detail (zoom level is shown on the vertical slider on the left hand side and in the lower left corner of the screen):
At level 17, you get a pretty good view of Benao Anchorage near Punta Mala in Panama on Google Satellite:

Zooming in to level 18, Google uses a different satellite image that shows no bottom detail at all, lost in the reflection of the sun on the water:
Bing is almost as good as Google at Zoom level 17:
But Bing loses detail to clouds and their shadows at Level 18:
The current practice among many providers seems to be to occasionally use different satellite passes and images for odd and even zoom levels, so it’s always worth a look to see what you’ll get before you download and create your MBTiles. In some cases, a lower zoom may provide more useful detail.
OpenCPN Has Changed Too
OpenCPN now supports zoom levels up to 20 (previously just up to 18), but still suffers lag when indexing very large MBTiles for display. Keeping your files smaller with lower zoom levels and/or smaller coverage areas will give you better performance (less lag) when using them. Doing 100-200 miles of coast, or about 250,000-500,000 tiles or less per MBTiles chart seems to give good display performance on my PCs, but yours may be different, so test a few before you go wild making a ton of charts.
Check Before You Make
It’s always worth a look around to find out what’s new in the neighborhood before an MBTiles chart-making session. Make sure you have an up-to-date version of SASPlanet and OpenCPN, and have a browse in the Maps tab to see what’s new and what suits your need before committing the time to download images and make your MBTiles. Sources change and using the right ones can make a huge difference in the result. Like so many things in the cruising life, curiosity and flexibility are often rewarded in this endeavor.


Thanks, Rob, for updating us on this. Your articles are always a valuable resource.
Cameron
Excellent article. Thanks for clear examples.
For those who don’t want to make their own MBTiles, you can download lots of them at TheChartLocker.com.
Cheers,
Bruce
s/v Migration
Thanks Bruce. Love the http://www.theChartlocker.com, great resource!